

Disclaimer: This article should not be construed as investment advice. The goal of the article is to help create an investment framework for crypto-assets and the author is not responsible for any losses arising out of investment in crypto or any other kind of investment.
Note: For the purpose of this article crypto-assets include cryptocurrencies, stablecoins, all kinds of crypto tokens, crypto derivative coins, and all crypto-related assets.
Previous article here: https://www.fintechna.com/articles/framework-for-investments-in-crypto-assets-part-13/
One approach to crypto investments is adding crypto-assets to existing fiat portfolios. Goldman Sachs Senior Multi-Asset Strategist Christian Mueller-Glissmann found that
“Small allocation to bitcoin in a standard US 60/40 portfolio since 2014 would’ve led to strong outperformance, owing both to higher risk-adjusted returns for bitcoin compared to the S&P 500 and US 10y bonds, as well as diversification benefits from relatively low correlations between bitcoin and other assets.”
We can approach choosing crypto-assets to add to our existing fiat portfolio as we do that with any other asset class - evaluating the return and risk of the asset and choosing an asset that increases the risk-adjusted return of the existing portfolio. We are considering crypto-assets as an alternative investment class such as gold and private equity.
Let us do a sample analysis. Please do not consider this as investment advice and do not take your investment decisions based on this analysis. The analysis is based on data collected from Coinmarketcap.com and considers capital gains as the only source of return and volatility as the only source of risk. In reality, crypto-assets can have other sources of return such as staking or yield farming and other sources of risk such as regulatory risk and technological risk, etc. Please read the previous article in this series to learn more about return and risk drivers for crypto-assets.
Okay, now let us dive into the analysis. I have calculated the rolling 365-day return for a basket of crypto-assets from 1st January 2019 to 23rd October 2021. So, the average return is calculated as the average of all 1027 data points of trailing 365-day period returns between the dates mentioned i.e. 1st Jan 2018 - 1st Jan 2019, 2nd Jan 2018 - 2nd Jan 2019…...23rd October 2020 - 23rd October 2021.
Please note that the returns are calculated based on crypto-asset prices denominated in USD.
The rationale behind choosing average rolling returns is that choosing returns only between specific dates, say first and last days of the year, would distort the comparison. crypto-assets can be highly volatile and considering returns only between some specific dates for comparison may distort the comparison in favor of assets that only performed well during the chosen dates. The average rolling return for the whole period would be able to capture all return possibilities and the volatility of returns more effectively. For example, Dogecoin's price as of 23rd October 2021 was $0.2517 compared to $0.008909 as of 1st January 2018. A simple annualized return calculation will give an average annual return of 140% but it would miss that someone who invested in Dogecoin on May 7 2020 and exited on May 7, 2021, could have earned a whopping 25,705% return. 90-day and 30-day rolling returns can be used in the comparison for a more comprehensive analysis. The average return values are not useful in annual performance reporting but are used only for comparison of the crypto-assets to make a forward-looking judgment.
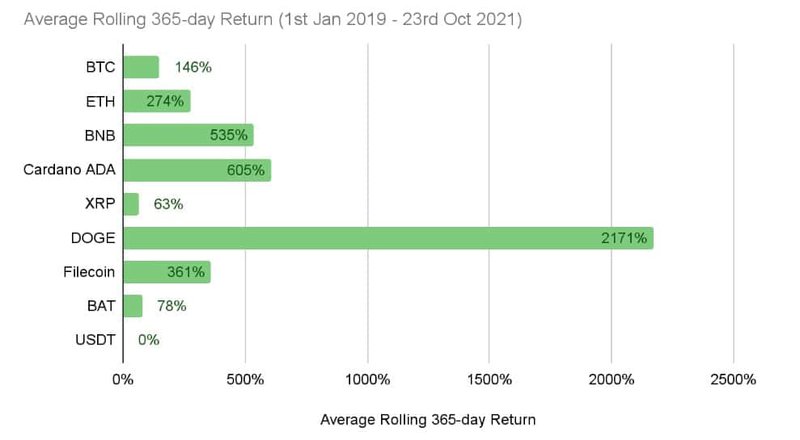
We can see that Dogecoin performed unbelievably well compared to other crypto-assets in the sample. USDT is a stablecoin pegged to USD and is not supposed to grow in terms of USD.
Return is only one side of the story. The other side is the volatility of the returns.
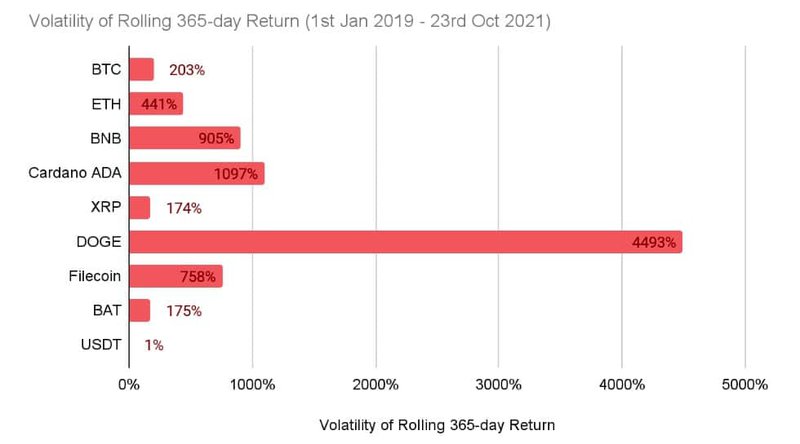
We can see that Dogecoin is also highly volatile compared to all other crypto-assets in the sample.
We can rank the crypto-assets by calculating risk-adjusted returns using metrics such as Sharpe Ratio. I am not doing it here because that would appear like a recommendation for specific crypto-assets while the goal of this article is to create a framework for choosing crypto-assets to include them in fiat portfolios.
While return-risk-based analysis is helpful, it is not enough for long-term investment. Apart from other sources of return and risk, we also need to understand the liquidity of the asset. A scarcely traded asset can be difficult to liquidate and assets held tightly among few owners should be considered a red flag.
A way to measure liquidity is through 24-hour trading volume compared to the market capitalization of the asset and holding concentration through the number of crypto wallets holding the asset. For example, as of 26th October 2021, Bitcoin had a 24-hour trading volume to market cap ratio of 2.7% and around 38.6 million wallets held Bitcoin.
The whole point of the above analysis is to choose crypto-assets that can be added to existing fiat asset portfolios i.e. treating crypto-assets as an asset class.
The performance of the crypto-asset as a part of a portfolio is measured using the same benchmark the portfolio performance is measured with.
The next step is to create standalone crypto-asset portfolios. We will discuss that in the next article: https://www.fintechna.com/articles/framework-for-investments-in-crypto-assets-part-33/