
India recorded Rs. 1,378 trillion or US$19 trillion (@1USD=Rs.72.8) digital transfers in the 12 month period from December 2019 to November 2020. Mobile app-based payments represented around 5% of the total digital transfers in this period. The pandemic has given a boost to adoption of the mobile app-based transfers. Data from the Reserve Bank of India show that mobile app-based payment’s share in digital transfers increased from ~4% in November 2019 to ~7% in November 2020.
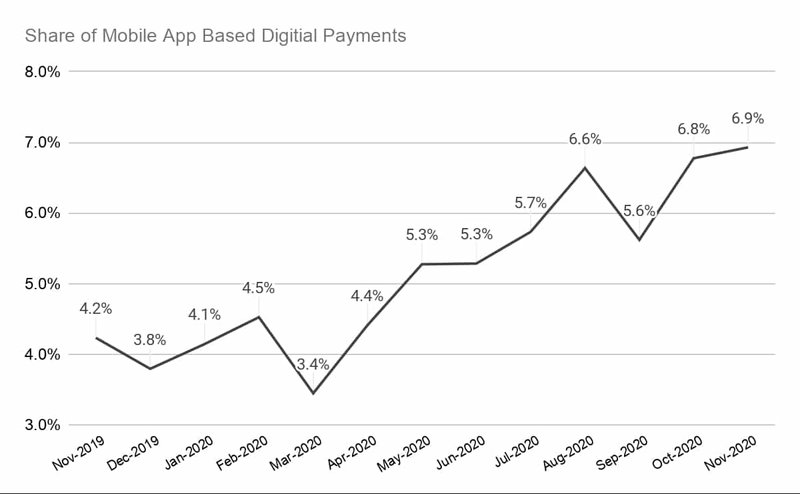
Data: (Reserve Bank of India) + Calculations by the author
The growth of app-based payments was driven by Unified Payments Interface or UPI, an instant real-time payment system developed by the National Payments Corporation of India (NPCI). UPI facilitates account to account (A2A) inter-bank transactions in India through mobile devices. The rise of UPI has attracted the big tech companies such as Google, Facebook, and Amazon to the Indian payment landscape. This article looks into the retail payment landscape in India and trends emerging with UPI.
Retail Payment Landscape in India
As of November 2020, the monthly retail payment in India stood at Rs. 37.4 trillion (US$513 billion (@1USD=Rs.72.8) a 20.8% increase from the same month in 2019 in spite of the drag by the COVID-related lockdowns in the middle of 2020.
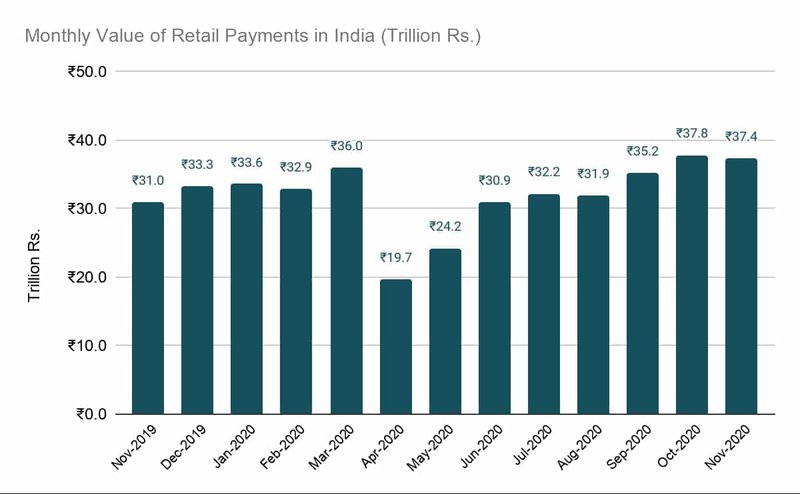
Data: (Reserve Bank of India)
Credit transfers are the most popular payment method in retail payments both in terms of volume of transactions (~70%) and value (~80%). UPI falls into this category.
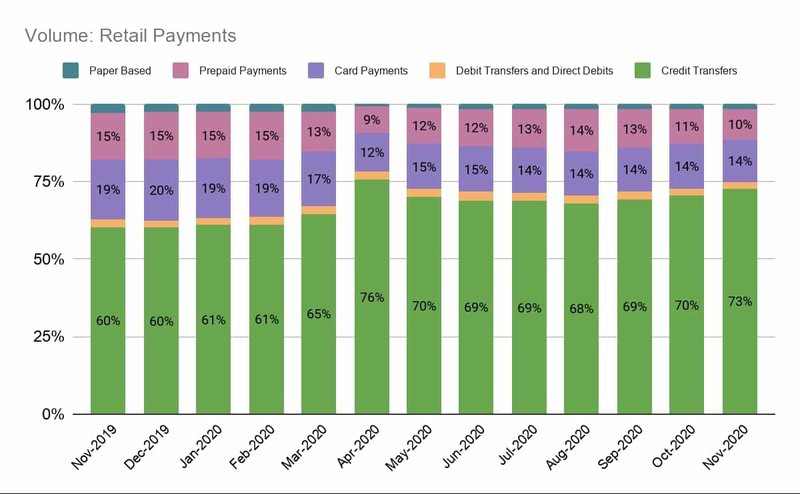
Data: (Reserve Bank of India) + Calculations by the author
Prepaid payment instruments are used for lower amount transfers. Paper-based payment instruments are negligible by volume but they are significant by value.
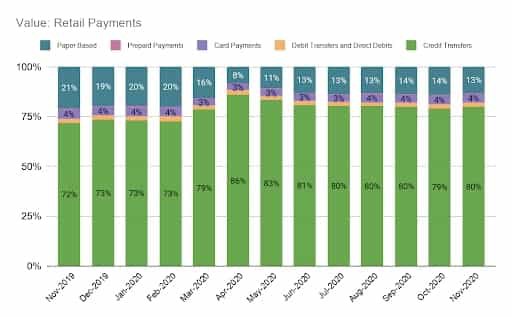
Data: (Reserve Bank of India) + Calculations by the author
Paper-based instruments are used for very high-value transactions, credit and debit transfers for average value transactions, and prepaid payments for low-value transactions.
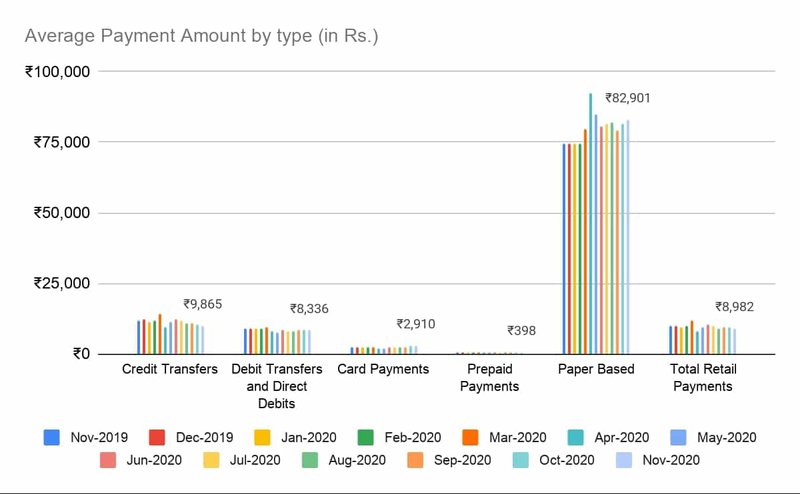
Data: (Reserve Bank of India) + Calculations by the author
Rise of UPI
UPI was launched in 2016 to introduce real-time payments in India. UPI removes many frictions from the earlier payment methods by circumventing the card networks completely. For consumers, this leads to less friction - no need to carry cards or remember credentials, use of a single application to access different bank accounts, and a single-click authentication. For merchants, this means instant receipt of payments, 24x7 availability, low or nill transaction cost, no requirement to store customer credentials, and tap customers without credit/debit cards. For banks, UPI means no deposit leakage as in the case of stored value products (wallets or cards).
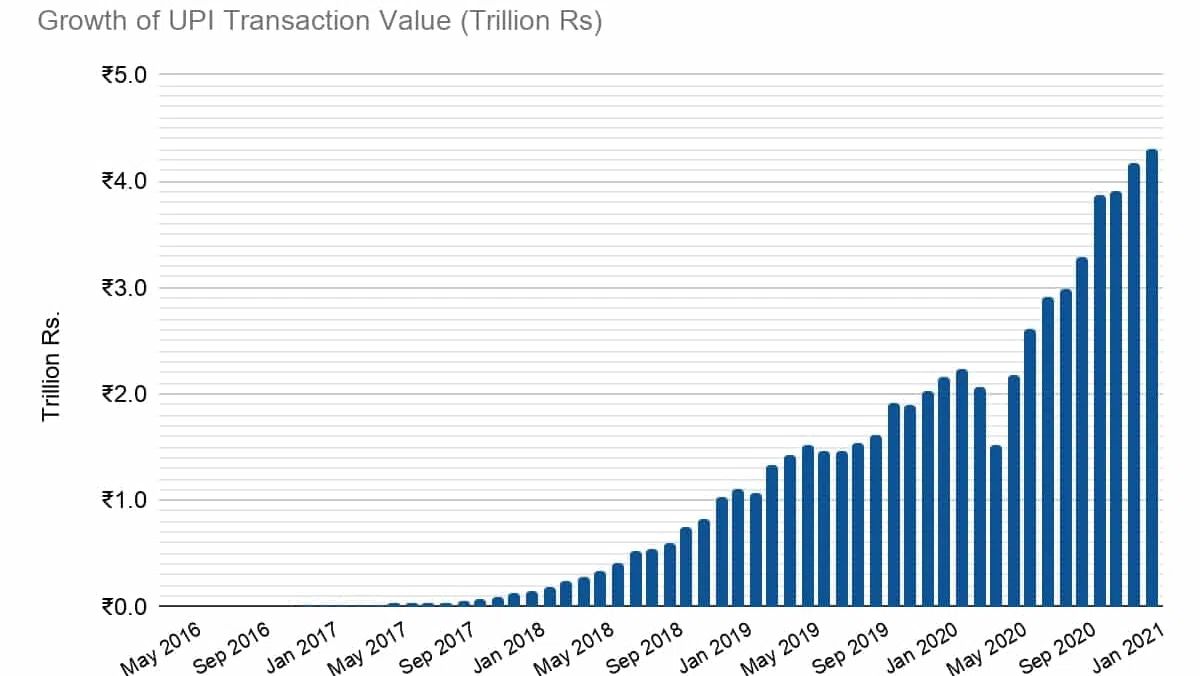
UPI is managed by the National Payments Corporation of India (NPCI) and regulated by the Reserve Bank of India. As of date, there are 207 banks live on UPI. In January 2021, UPI processed 2.3 billion transactions worth Rs. 4.3 trillion or US$59 billion (@1USD=Rs.72.8). The transaction value is currently growing at around 100% per year. (NPCI)
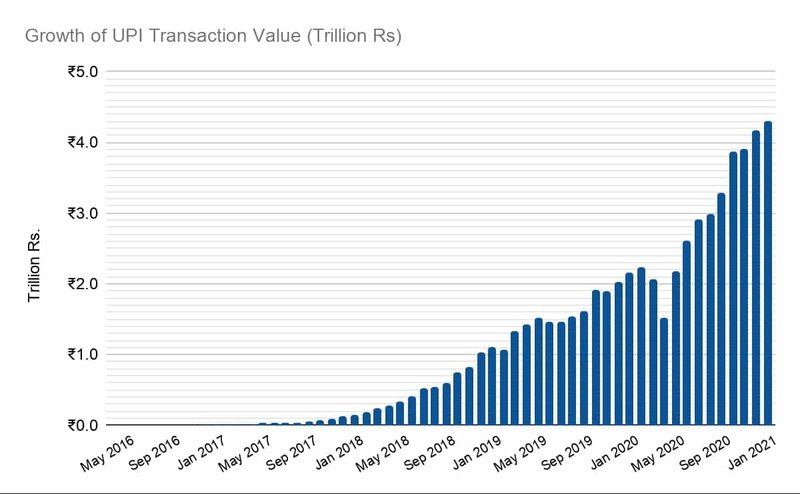
Data: (NPCI)
UPI volume share in retail transfers increased from less than 40% in January 2020 to more than 50% by November 2020.
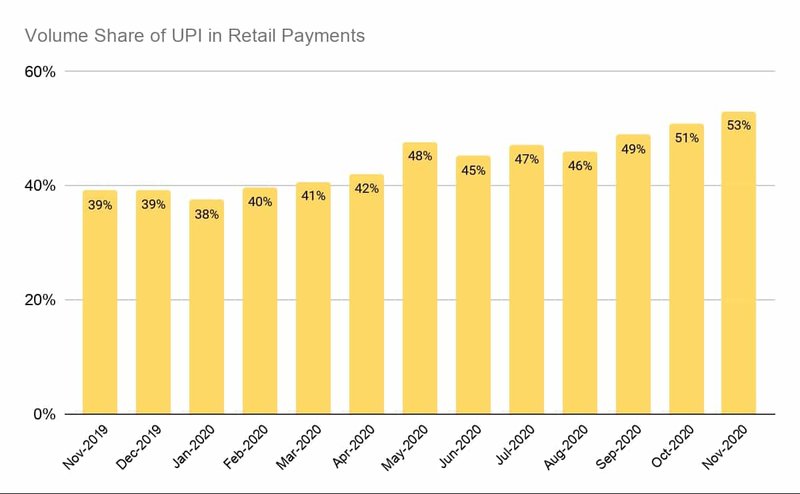
Data: (Reserve Bank of India) + Calculations by the author
UPI value share in retail transfers increased from 6% in January 2020 to 10% by November.
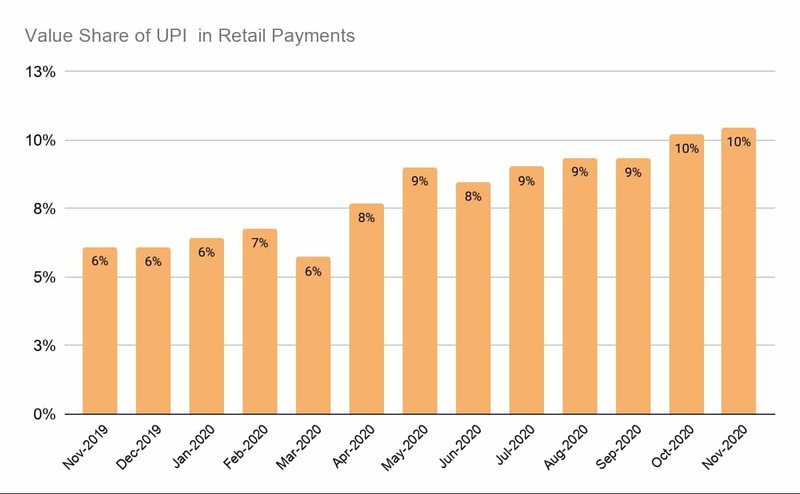
Data: (Reserve Bank of India) + Calculations by the author
While UPI got hit by the COVID-19 lockdowns similar to other payment instruments, it rebounded stronger partially due to the fact that UPI is highly subsidized. The government of India waived off Merchant Discount Rate (MDR) on transactions on UPI. UPI member banks also decided not to charge any fee on the UPI transactions.
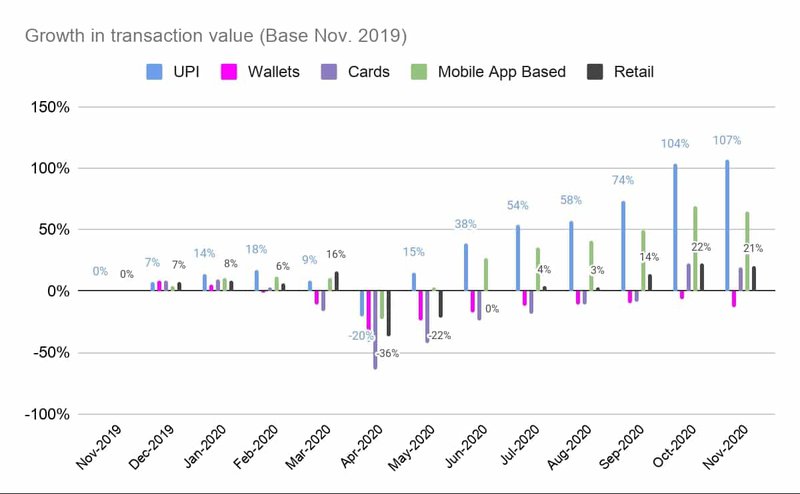
Data: (Reserve Bank of India) + Calculations by the author
Although the volume of UPI is growing rapidly, they are still used for low-value transactions compared to other modes.
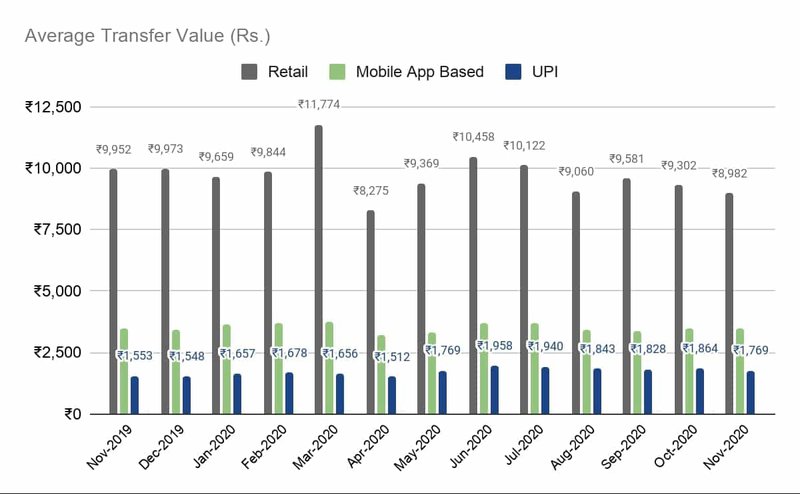
Data: (Reserve Bank of India) + Calculations by the author
UPI Competitive Landscape
As mentioned before, the growth of UPI has attracted big tech players to the payment landscape of India. The top 3 players, who collectively hold more than 90% share in the UPI payments, are Walmart backed PhonePe, Alphabet backed Google Pay and Softbank & Ant Financial backed Paytm.
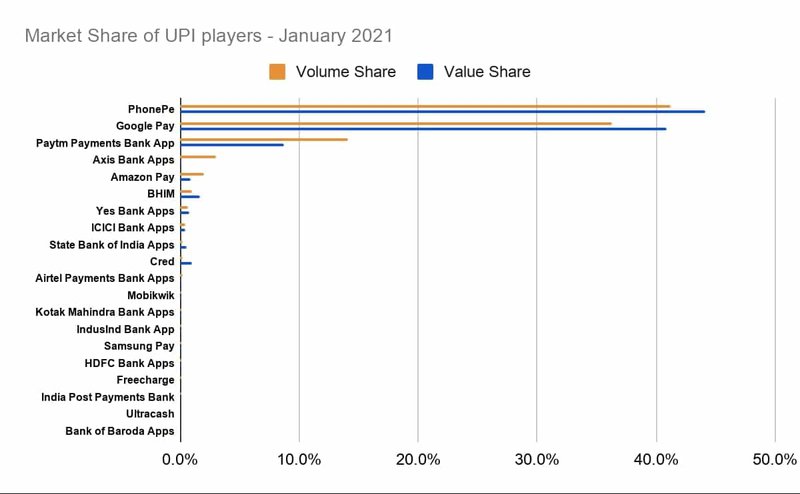
Data: (NPCI) + Calculations by the author
As of January 2021, PhonePe and Google Pay both had more than 40% market share. But, last year NPCI declared a cap of 30% by volume of transactions on all the Third-Party App Providers (TPAPs) was supposed to be affected from 1st January 2021. TRAPS are the players who offer UPI payment to consumers but are not UPI live members and access UPI through existing live members. PhonePe and Google Pay both falls into this category. PhonePe accesses UPI through Yes Bank, ICICI Bank, and Axis Bank. Google Pay accesses UPI through Axis Bank, HDFC Bank, ICICI Bank, and State Bank of India. Paytm Payments Bank is a PSP itself so this cap is not applicable for Paytm. The existing TRAPs will have two years to comply.
UPI Players are using payments as a customer acquisition channel for other services. For example, PhonePe offers insurance, mutual funds, gold purchase, ride booking, and food delivery, etc. through their app. Other players are using payments to ring-fence their existing businesses such as Banks and eCommerce players.
Payment in Indian is not for players with shallow pockets. Four players - Paytm, PhonePe, Google Pay, and Amazon Pay — spent around $995 million on advertising, marketing, and promotional expenses only in FY19.
Facebook backed Whatsapp Pay got approval in November 2020. With more than 400 million users in India, Whatsapp Pay is likely to become a major competitor in the UPI space in the coming years. PhonePe has around 100 million monthly active users and Google Pay 67 million. It will be interesting to see how Whatsapp changes the landscape in the coming years.
Bibliography
NPCI. “UPI Ecosystem Statistics.” www.npci.org.in, 2021, https://www.npci.org.in/what-we-do/upi/upi-ecosystem-statistics. Accessed 9 February 2021.
NPCI. “UPI Live Members.” www.npci.org.in, 2021, https://www.npci.org.in/what-we-do/upi/live-members. Accessed 9 February 2021.
NPCI. “UPI Product Statistics.” www.npci.org.in, 2021, https://www.npci.org.in/what-we-do/upi/product-statistics. Accessed 9 February 2021.
Reserve Bank of India. “Payment System Indicators.” Database on Indian Economy, 2020, https://dbie.rbi.org.in/DBIE/dbie.rbi?site=home. Accessed 9 February 2021.